Architecture of Responsive Spaces
An exploration of hybrid computational and physical space, Architecture of Responsive Spaces shows how habitations configured of physical matter and responsive computational media can be built.
TEAM MEMBERS
Elizabeth Adams withoutwingsmusic@hotmail.com
Erik Conrad erik.conrad@peripheralfocus.net
Yoichiro Serita gtg549c@prism.gatech.edu
Maryann Westfall maryannwestfall@comcast.net
CONCEPT
To dynamically visualize “invisible relationships” or similarities between strangers encountering one another in a public space.
• Introduction
• Goals and Objectives
• Representational Connections Explored
• Line Qualities Explored
• Process Overview
• Equipment List
• Challenges
• Schematics
In public spaces, people create paths in many directions as they walk. Some paths cross as unaware strangers bypass each other. Some paths merge, as with lovers meeting for a rendezvous. In crowds, people may walk uncomfortably near others, invading their personal space. And some paths diverge, as when neighbor commuters part for various office destinations.
This project is an experiment in creating a space that recognizes the untraveled paths between people. The created space will be responsive to the presence of individuals. As people enter the space, connections between individuals are “drawn” onto the ground via an overhead projector. The purpose is to provide a visualization of the “Invisible Relations” between people, provoking an awareness of those relationships and perhaps inviting new and unanticipated interactions among the individuals.
• identify and map relationships
between people
• provide an unexpected entertainment
experience
• provide an unexpected communication
experience
REPRESENTATIONAL CONNECTIONS EXPLORED
The kinds of relationships that can be mapped are numerous, each evoking its own emotional response. Some hypothetical scenarios that were explored:
1) “Closest One Wins” — multiple individuals enter a space: the two closest individuals are connected; that connection may change as another individual moves closer to one of the individuals in the original pair, or if two new individuals become closer to each other than the original pair.
2) “Exclusive Couples” — multiple individuals enter a space: the two closest individuals are connected; in addition, the next two closest individuals are connected, and so on; if an individual moves closer to another couple’s partner, that person becomes the new partner.
3) “Tail Wagging the Dog” — two closest individuals have a thick line drawn between them; as they move apart, the line becomes longer and thinner in the middle, until maximum length is reached.
4) “Networking” — draw a line between each of the individuals in a given space, based on maximum proximity.
5) “Inside-Out Voronoi (alias, Deloney Triangulation)” — lines between everyone with “no intersections” rule.
6) “Popularity Contest” — one individual has numerous lines connected to him/her based on multiple proximity “hits.”
7) “Shape Shifter” — when several random individuals are detected in a shape pattern, such as circle or pentagon, the shape is drawn with lines connecting them.
In addition to different mappings, different kinds of line representations can be used to affect various emotional responses. Some of these line types are:
- short fat line — may give weight to a close relationship
- long thin dashed line — may emphasize a borderline relationship
- variable line width — may emphasize the change in the relationship over time: thinner in the middle as individuals move apart, or may indicate one individual emphasized over another: one end of line thicker than the other
- colored lines — for a “festive” atmosphere in a popularity contest
- squiggly-to-straight line — may indicate tension
- arrow — may indicate direction of movement
1) An overhead camera recognizes when people enter a specific zone.
2) A line is drawn dynamically between two or more people who have some kind of relationship or similarity by recognizing some properties via the overhead camera (or other sensors in the environment).
3) In some instances, if people move, the line follows. In other instances, the lines may redraw between other pairs. In yet other instances, the line may change its characteristics as the people move.
• overhead camera
• overhead projector
• computer
• Max 4 software
• extension cord and/or generator (for actual public spaces)
• curious guinea pigs
Optical recognition is a challenge that must be addressed. Our system proposes using a camera that is suspended from above the responsive space. A variable for us to determine is the distance from the responsive “grid” that the camera must be suspended. To capture a 20' x 20' space, the camera should be suspended about 40' above the ground.
Tracking individuals as they move in the responsive space will be the largest challenge to overcome. One way in which to achieve this is to map the responsive space into a physical grid of about 2' x 2' (a space large enough for one person to comfortably occupy). The grid would correspond to a computational grid in which each square represents 20 x 20 pixels (the resolution required to effectively draw diagonal lines). In using a high-resolution camera, a computational problem exists when the program must interpolate the massive amount of pixel information from the video into usable pixel information on the computational grid. Our resident technician, Erik Conrad, has devised a more economical way of implementing this translation of pixel value: we will use a low-resolution camera to capture only a minimal number of pixel values per grid square (enough to detect a change in value as someone enters that square). Erik is also writing the code for this miraculous transformation of movement to pixels.
Writing a drawing program is the next largest challenge for our project. Our resident programmer, Yoichiro, has pounded Max into submission, developing patch-layered tools for the more technically-challenged team members, Elizabeth and Maryann. The sample relations that the program was written to accommodate was the “Closest One Wins.”
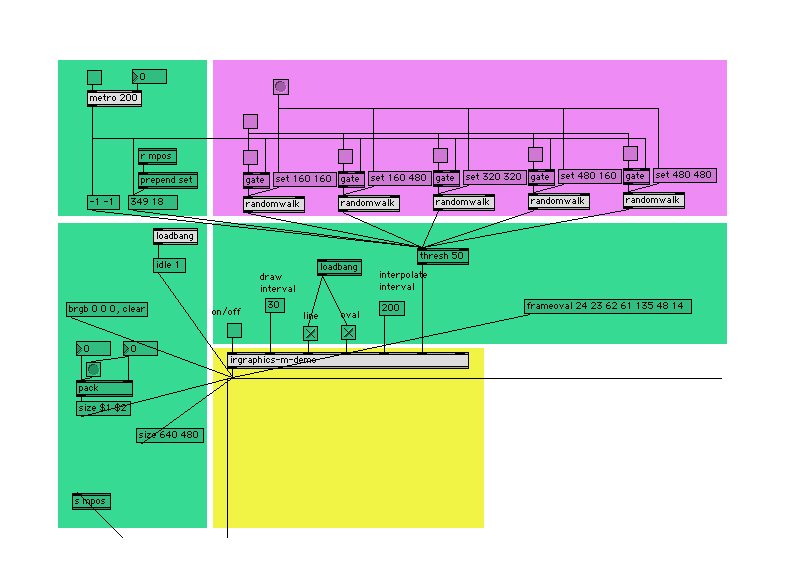
Click on each area for an enlargement.
Area A — starts off the process with a bang, literally and figuratively. A bang is sent every .2 seconds to the positional input fields (top green area). At the same time, a bang is sent to begin tracking mouse position in demo mode (left green area).
Area B — initially set up with an arbitrary first set of coordinates, this array (which represent five dark-valued pixels of the translated walking grid) are updated every .2 seconds. The information is fed to Area D. (Click on purple rectangles in main schematic for detailed view.)
Area C — mouse position is sent to Area D (demo mode only). Also, a “dummy” set of values is sent to Area D to reconcile discrepancies between scanning programming and drawing programming. As the mouse moves, the C1 area sends new mouse position back up to Area C, and its coordinates are fed into the program.
Area D — the coordinate sets are unpacked and sent to their respective input fields: point 1 on one side, point 2 on the other side. D1 is a “holding bin” for line information. D2 is a holding bin for special messages information (in this case, an expanding circle). D3 is a holding bin for circle information. D4 sends the signal to draw all the elements. D5 sends a “clear screen” signal every 50 ms. Without this feature, all lines, messages and circles that are drawn (every .2 seconds) would remain on the image and would result in a cumulative mass of information.
Area E — this area of programming controls LCD screen variables (size and background color).
Go back to Maryann Westfall, the designer home page
Go back to Jumping Weasel, Inc. home page
Go back to JumpingWeasel.com Online Job Board home page
Go back to The Westfalls' personal home page
© 2004 Jumping Weasel Corporation. All rights reserved.
|
|
|
Professor: • Sha Xin Wei |
Principles:• An exploration of hybrid |
Project:• Invisible Relations |